One of the biggest mistakes marketers make is obsessing over reach. This primitive metric is often given focus while ignoring the core objective: Actions.
There are obvious connections between reach and actions. If you don’t reach any users, you won’t get any actions. And if you get lots of actions, you likely reached lots of people.
If Facebook works the way it should — rewarding engaging content and showing content to people that appears to be interesting — reach should be expanded for particularly good content.
Still, reach is also impacted by other factors — namely competition in the news feed and number of users online at the time of posting.
For example, a good post may reach fewer people than normal due to high competition or low number of users online (think the holidays) while another poorer post may reach more people than normal due to the opposite (think posting in the middle of the night).
I regularly see exceptions to the “reach vs. actions correlation” rule, but how often does this happen? I decided to dig deeper into my data to find out.
Cleaning Up the Data
First, I exported post level Insights data from October 1, 2014 through March 20, 2015. I clearly can’t compare results from different post types, so I decided to focus on the post type with the greatest sample size: link shares. And since I was using link shares, I am focusing on the most important action associated with links (conversions did not apply here): the website click.
I then ran into something that I knew would present a problem. Of the 104 links I shared during this time, 31 received promotion.
This is an issue for a number of reasons:
- Promoted and organic impressions are not equally likely to result in an action
- I did not promote all posts equally
- Promotion results in imbalanced frequency
While I could technically subtract paid actions from paid actions, that’s a messy proposition due to the way Facebook measures reach. Once a user is reached both paid and organically, Facebook no longer counts the organic impression. And since I target my ads at the audience most likely to act — fans and website visitors — any promotion would dilute the apparent effectiveness of the organic impression.
Because of these things, I knew that I needed to remove promoted posts from this research.
This is unfortunate. I promote all of my recent blog posts. Some of my most effective posts, as a result, have been promoted. And there are more examples of posts with high reach within those posts.
Still, this was an obstacle that was going to cause too much confusion if not removed. Focusing only on posts that did not receive promotion left me with 73 posts that tended to fall into two different categories:
- Links to websites other than my own
- Links shared during the “Top 33 JonLoomer.com Posts of 2014” countdown
The countdown, in particular, happened during the holidays so such posts naturally resulted in less reach than normal. But including these posts gives me a decent sample size to work with.
Results: Top Level Overview
These 73 posts received a wide range of both reach and website clicks.
Reach
- MAX: 48,528
- MIN: 3,970
- MEDIAN: 12,316
Website Clicks
- MAX: 2,735
- MIN: 2
- MEDIAN: 190
It hurts that some of my promoted posts aren’t included here since some of them received more than 5,000 or even 8,000 website clicks. But I digress.
I’m convinced that a couple of the low website click results (like the lowest result, which was a pathetic 2) are bugs in reporting. It seems highly unlikely, but I felt it wouldn’t be honest to remove them. And such potentially bad data just makes it more important to have larger sample sizes.
The post with the highest reach actually did end up with the most website clicks, but there were only two posts in the sample that had reach in that range. There were plenty of exceptions as well, and we’ll get to that later.
Reach vs. Website Clicks
First, let’s take a look at reach and website clicks (stacked together by post) in order of most to least reach.
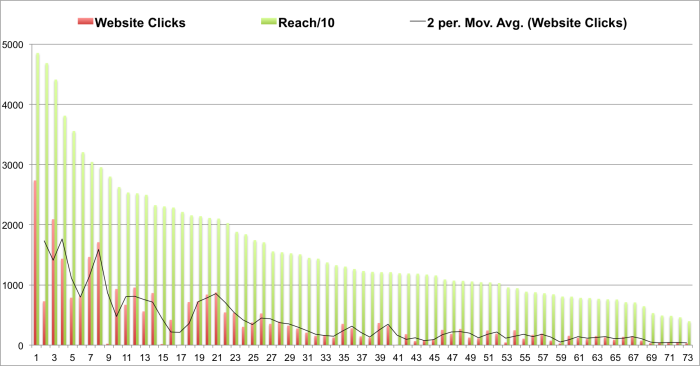
I included a trending line to help emphasize how website click totals trend related to a decreasing reach.
The website clicks trend is certainly downward as reach decreases. However, there were clear and obvious exceptions where website clicks were higher or lower than the expected amount (noted by peaks and valleys in the trend line).
Let’s also take a look at the same data, but from a slightly different perspective. Now let’s view this in order of highest to lowest website clicks, with the trending line relating to reach.
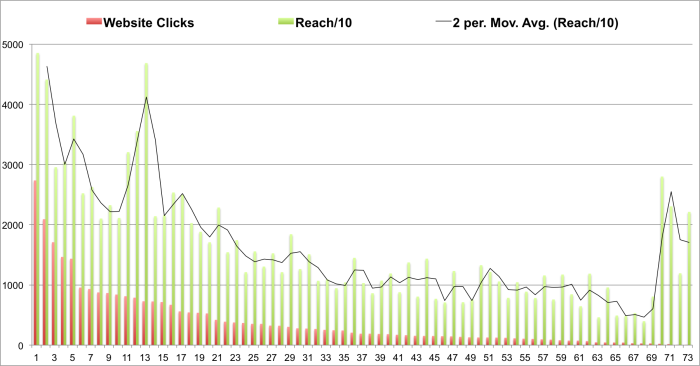
Once again, reach does clearly trend downward as website clicks decrease, however there are very pronounced exceptions at both ends of the graph. In both cases, there were clusters where reach was notably higher than the expected number of website clicks.
Actions by Reach Range
Let’s look at this slightly differently now.
I then grouped posts by the following reach ranges (number of posts that qualify in parentheses):
- 30K-50K (7)
- 20K-30K (15)
- 10K-20K (30)
- less than 10K (21)
First, let’s look at the rate at which those reached clicked on the link, broken down by reach range. I’ve included maximum, minimum and median range for each.
| Reach Range | HIGH | LOW | MEDIAN |
| 30K-50K | 5.6% | 1.6% | 3.8% |
| 20K-30K | 5.8% | 0.0% | 3.3% |
| 10K-20K | 3.1% | 0.1% | 1.8% |
| less than 10K | 2.6% | 0.4% | 1.2% |
This is largely consistent with what we saw before. If a post reached more people, on average it received more website clicks. That is apparent based on trending maximum, minimum and median website click rates.
Of course, there are notable exceptions in the table above. The maximum website click rate is slightly higher for the 20K-30K range than the 30K-50K range. There are also some clear poor performers in each group, and while the highest range group had the highest minimum, the order was not as expected thereafter.
As we dig deeper, you can also see that the highest performers in the 20K-30K, 10K-20K and less than 10K ranges all outperformed the worst performer in the 30K-50K range in terms of website click rate.
Did posts that received a higher website click rate automatically reach more people? In general, yes, but clearly that’s not always the case.
Now let’s take a look at maximum, minimum and median website click totals by reach range…
| Reach Range | HIGH | LOW | MEDIAN |
| 30K-50K | 2735 | 728 | 1435 |
| 20K-30K | 1709 | 2 | 715 |
| 10K-20K | 537 | 6 | 225 |
| less than 10K | 247 | 29 | 103 |
The maximum and median website click totals all trended consistently with reach range. Once again, while the highest minimum number of website clicks was in the highest reach range, the order was not consistent thereafter.
Moreover, the highest number of website clicks in the 20K-30K reach range was higher than the lowest and median number of website clicks in the highest reach range.
Individual Exceptions
There are some specific posts that offer clear examples of exceptions that go outside of expected reach vs. action correlation.
First, there were three posts in the 20K to 30K reach range that received 23 or fewer website clicks. Every single post in the lowest reach range received more website clicks than that.
Again, I have my doubts about this, but the data is the data. If the posts were performing that poorly, we wouldn’t expect the reach that they received. And if we focused only on the reach we would have assumed success.
Second, there were three posts in the 30K to 50K reach range that received 812 or fewer website clicks…
- 46,840 reach, 728 website clicks, 1.6% rate
- 35,568 reach, 788 website clicks, 2.2% rate
- 32,048 reach, 812 website clicks, 2.5% rate
Meanwhile, there were six posts in the 20K to 30K reach range that outperformed the above three posts high performing reach posts in terms of website clicks…
- 29,552 reach, 1,709 website clicks, 5.8% rate
- 26,256 reach, 932 website clicks, 3.5% rate
- 25,216 reach, 956 website clicks, 3.8% rate
- 23,248 reach, 865 website clicks, 3.7% rate
- 21,128 reach, 840 website clicks, 4.0% rate
- 21,024 reach, 875 website clicks, 4.2% rate
The most obvious variance is that all six of these posts received more website clicks than one that reached in some cases more than double the users.
Finally, the eight worst performing posts according to website clicks in the 10K to 20K reach range were outperformed by eight posts that reached fewer than 10,000 people.
There are several other individual exceptions, but these all stood out.
KPI vs. Secondary Metric
How important is organic reach? I think it is something that is influenced by the quality of your post, but it is not the main metric you should be using to determine success.
Don’t let reach prevent you from monitoring the objective metric that matters: Actions!
Your Turn
What are you seeing? What relationship are you seeing between reach and actions?
Let me know in the comments below!
Category: PHC Blog Uncategorized