Measuring ROI is a significant struggle for marketers. Even in times when it appears to be easy, we may be oversimplifying the results.
This fact is highlighted in a series of campaigns I recently ran to increase Power Hitters Club memberships. There were two campaigns in particular that appeared to do quite poorly until you consider their role in the process.
The Campaigns
The three campaigns I ran worked as follows…
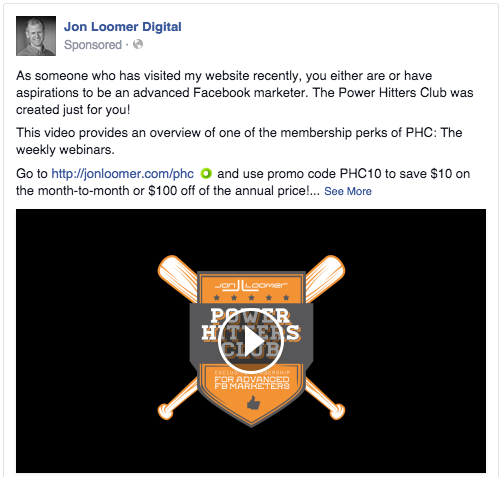
Campaign #1: PHC Recruitment Video – Webinars
Post Type: Video
Description: This Facebook video highlighted the benefits of PHC by focusing on the weekly webinars. There was a CTA button that drove people to the PHC landing page. I created three different ad sets for three different groups of website visitors: 14 days, 30 days and 180 days.
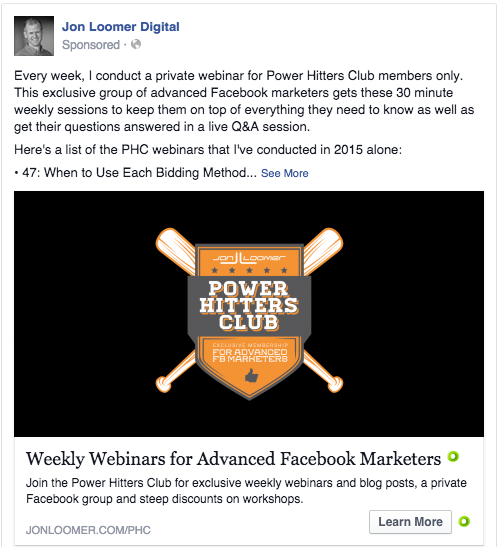
Campaign #2: PHC Recruitment Link – Webinars
Post Type: Link Share
Description: This link share also highlighted the benefits of PHC by focusing on the weekly webinars. This time, though, the link was the vehicle. It also drove people to the PHC landing page. I created three different ad sets for three different groups of website visitors: 14 days, 30 days and 180 days.
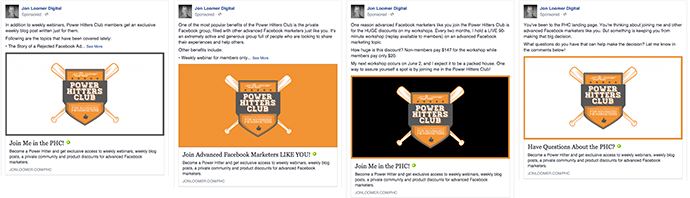
Campaign #3: PHC Abandoned Cart – Conversions
Post Type: Link Share
Description: This campaign was split into four different ad sets. Each ad set focused on a different angle or benefit, targeting those who visited the PHC landing page during a different duration…
- Visited 1 Day: PHC Blog Posts Focus
- Visited 3 Days (not 1): Private Facebook Group Focus
- Visited 5 Days (not 3): Discounts Focus
- Visited 7 Days (not 5): Do you have questions?
Campaign Performance
When considering Immediate Revenue Value (first month of membership revenue being $97) vs. Spend, it would appear that Campaigns #1 and #2 performed poorly while Campaign #3 was quite good.
Campaign #1
- Spent: $1,033.27
- Website Clicks: 96
- Cost Per Website Click: $10.76
- Sales: 3
- Cost Per Sale: $344.42
- Immediate Revenue Value: $291
- IRV vs. Spend: .3
Campaign #2
- Spent: $413.43
- Website Clicks: 559
- Cost Per Website Click: $.74
- Sales: 3
- Cost Per Sale: $137.81
- Immediate Revenue Value: $291
- IRV vs. Spend: .7
Campaign #3
- Spent: $157.01
- Website Clicks: 150
- Cost Per Website Click: $1.05
- Sales: 26
- Cost Per Sale: $6.04
- Immediate Revenue Value: $2,522
- IRV vs. Spend: 16.1
In case you’re wondering, the number of conversions driven by each of the four ads for Campaign #3 is as follows:
- 1 Day: 10 Conversions
- 3 Days: 6 Conversions
- 5 Days: 4 Conversions
- 7 Days: 6 Conversions
So when applying a $97 value to all sales, I lost $742.27 with Campaign #1, lost $122.43 with Campaign #2 and made $2,364.99 with Campaign #3. Overall, it’s a $1,500.29 gain for all campaigns. Not terrible, but the first two weren’t good.
However, let’s take this one step further. The true value of a purchase really isn’t $97. My membership has only been around for a year so the data is still very incomplete, but the average value of a member so far is about $440 (this includes an influx of members the past few months, limiting the value).
Let’s then apply a $440 value for each sale…
- Campaign #1: Spent ($1,033.27), Value ($1,320), Value vs. Spend (1.3)
- Campaign #2: Spent ($413.43), Value ($1,320), Value vs. Spend (3.2)
- Campaign #3: Spent ($157.01), Value ($11,440), Value vs. Spend (72.9)
When we apply a conservative $440 value per sale, we are now looking at a total of $14,080 revenue on spend of $1,603.71. That’s pretty darn good!
Still, you could make the argument that Campaign #1 barely made me my money back and Campaign #2 was even a waste of time since Campaign #3 is what brought in all of the conversions.
But…
The Role of Each Campaign
It’s important to remember that these three campaigns worked together. This was a process — a funnel.
Campaign #1 worked to inform with a video. Some people clicked the video, but most didn’t. It targeted people who would know who I am. While it did result in some conversions, it mostly served to raise awareness in a unique way that didn’t require a click.
Campaign #2 targeted the same people as Campaign #1. This campaign started after Campaign #1 had already been running for a while. So some people viewed the video and didn’t act. This campaign focused on driving people to the website to learn more. There were 559 people who did just that.
Campaign #3 then picked up where Campaigns #1 and #2 left off. While the first two campaigns didn’t do a very good job of closing the deal, they introduced users to the product. Campaign #3 then focused only on those people already aware of the product and took a different angle — with great success.
Campaign #3 doesn’t have the people to target and convert without Campaigns #1 and #2 running. And Campaign #3 may also not be as successful without those first two campaigns informing my target audience the way they did.
This emphasizes that your eggs can’t all be in one basket. If I only would have run Campaigns #1 or #2, my success would have been minimal. I would have measured success only by the conversions that resulted, which wasn’t much.
But we must understand that people aren’t always ready to convert the first time they see or click on an ad. That ad can prime them — it can warm them up — but we need other ads to close the deal.
That’s precisely what happened here. My first two campaigns warmed up the audience and pushed them to my landing page. The third campaign closed the deal.
Your Turn
What do you think of these results? Do you run similar funnels with Facebook ads?
Let me know in the comments below!
Category: PHC Blog Uncategorized